




Washington State Data Exchange for Public Safety

Washington State Data Exchange for
Public Safety

WADEPS Dashboard

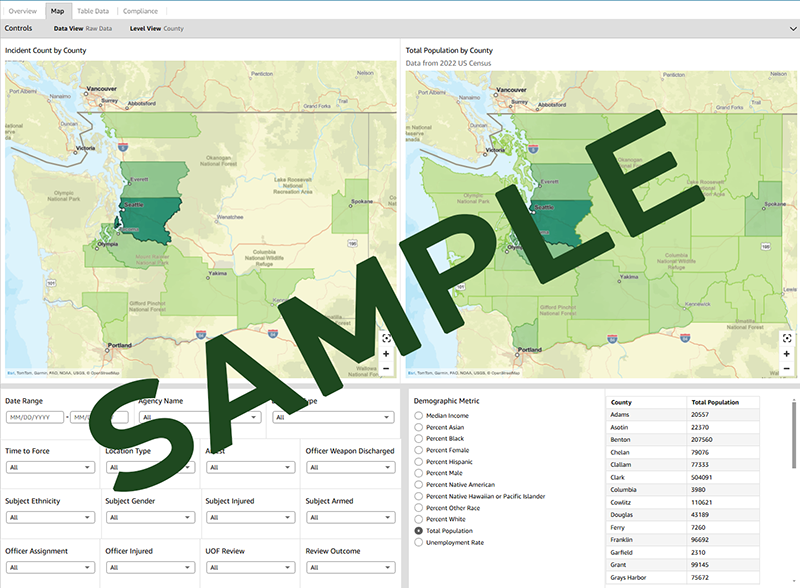
Side-by-side maps of the state of Washington above filtering options, all overlayed with the text "Sample".

Available

Public data should be freely available. The WADEPS data dashboard provides a common tool for community members, law enforcement leaders, policymakers, and researchers to review and access all of the data.

One Location

WADEPS serves as the data custodian, securely storing the standardized law enforcement data in a central cloud-based data lake. Our data mirrors data held individually by agencies and other contextual resources and is updated daily.

Standardize

Data comes in all shapes and sizes. The legislature established a set of standard data points and definitions so data from all law enforcement agencies across the state can be compared accurately and equitably.

Analysis

Data from all agencies will be securely stored in a central database, which will feed the WADEPS data dashboard.

Practical analytical tools to identify trends, assess the effectiveness of police practices, determine whether training is effective, and encourage civic participation and dialogue.

WADEPS goal is to help all dashboard users—individuals, agency leaders, legislators, and researchers alike—expand their understanding of the data and derive meaningful insights.

Legislative Requirments

Reportable Us of Force

Reporting Agencies

WADEPS identified 301 law enforcement agencies with general or limited law enforcement authority operating in Washington in 2024.

WADEPS established six categories to track agency participation and compliance with the law.

Widget/mini Dashboard or table or image with category name and definition
National Assessment of Statewide Use of Force Dashboards
Building a National Standard: 0% Baseline Alignment Reached Across All States

National Assessment of
Statewide Use of Force Dashboards

A inventory of statewide use of force reporting systems. This study examines 0 research-informed indicators to document what information is publicly available and where gaps remain.

Methods & References →
0

States

Benchmarked

Standard-Setting Portals

Leading High Alignment

Foundational Portals

Initial Implementation

Indicator Presence Across States

Commonly Available ↔ Not Yet Provided
Commonly Available Not Yet Provided

Alignment Levels

  • High Alignment (60%+)
    0
  • Advancing (30-59%)
    0
  • Foundational (<30%)
    0

Audit Detail

Order:

What Are States Reporting & What’s Missing?

Explore how use-of-force reporting compares nationally. Follow the flows to see which key indicators are consistently shared across 13 state dashboards and where critical data gaps remain.

The diagram groups reporting indicators by category and shows how many of the 13 reviewed state dashboards provide each indicator. Commonly Available means 10 or more states, Partial means 4 to 9 states, and Not Yet Provided means 0 to 3 states.